Brock Johnson

Hi, nice to meet you. My name is Brock
I love the outdoors, sports, and books
View My LinkedIn Profile
Mass. Education Analysis via Tableau

Education around the world can be considered one of the greatest contributions to a thriving society. Countries that have well-established education programs often yield high contributing individuals and families that make impactful differences in their communities. From a young age we learn, develop and foster relationships and principles of improving our skills in academia. These skills then can be applied to every day life like problem solving, conflict resolution, and innovation. We learn about History, Language, Social Studies, Math, Music, etc. Is anybody transported back to middle-school homeroom waiting for the bell to ring?
Me personally, I’ve always been interested in science and math. I’ve exceeded in those areas throughout my education journey and it has always been a fun challenge for me. Something about numbers and logic just makes sense.
Education and Data
The systemic approach to education from Pre-School up and through University follows important steps of learning and development from historical data. We are tested and examined for improvement through study and analysis from the beginning of the year to the end of the year. It’s a system that works well and helps us see where we are and where we can improve.
Why Does This Matter?
Education has had such a profound impact on my life and has significantly helped me get to where I am today. I’ve decided to look into some data regarding education that can provide significant findings and recommendations for improvement in key areas including: student achievements, graduation rates, and varying factors affecting progress.
My goal is to provide a comprehensive overview of schools in one specific state (Massachusetts) and to help policymakers, educators, and parents make informed decisions about the future of education in that and other states / countries.
Key Findings
9 out of the 10 the lowest high school graduating % come from economic disadvantages greater than 50% Class size DOES NOT have statistically significant influence on college attendance, BUT Economic Status does 25 % of districts in MA have lower than 50% proficiency in 4th Grade Math.
The Data
This is a real data set taken from the Massachusetts’ Department of Education. It comes from a combination of multiple reports. The original data set is from 2017 and can be found here. This dataset is slightly modified for educational and training purposes. I will be referring to a made-up scenario where I am working with the Massachusetts State Superintendent to figure out key areas of concern.
The data dictionary lists the report from which each field is sourced. It includes original field names and the dataset consists of 298 categories and 1861 different schools. The data came from an Excel csv file that was uploaded and analyzed through Tableau Public.
Questions to Consider
What schools are struggling the most with graduation rates? Does class size affect college admission? Does economic status? What are the top math schools in the state?
Analysis
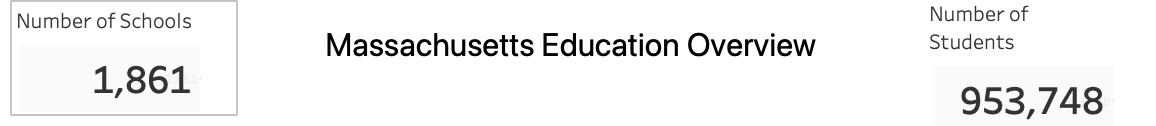
As I was looking through the Massachusetts schools and various data, I was initially curious at how many schools there were and the number of students enrolled.
Low Performing Schools
According to my work with the super intendant, they wanted to know which high schools are the bottom 10 in graduation %. In order to figure this out, I needed to compare the name of the school against the % of graduating. I filtered out any schools that did not have a graduation % and included only high schools as part of my search. The following bar chart illustrates the top 10 lowest graduating high schools in the state.
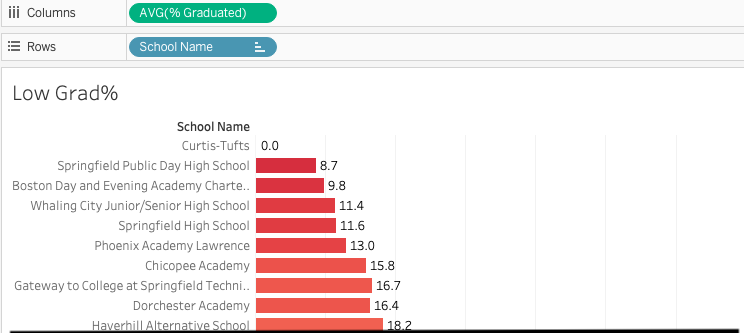
Out of 376 different schools in the state, 37 of those schools were below 50% graduation rate. I was curious to see if these schools, especially the bottom 10, had any correlation to economic status. Upon further investigation, I measured the graduation percentage against the economic status. The chart below shows us that 9 out of the 10 bottom schools in the state had an economic disadvantage greater than 50%.
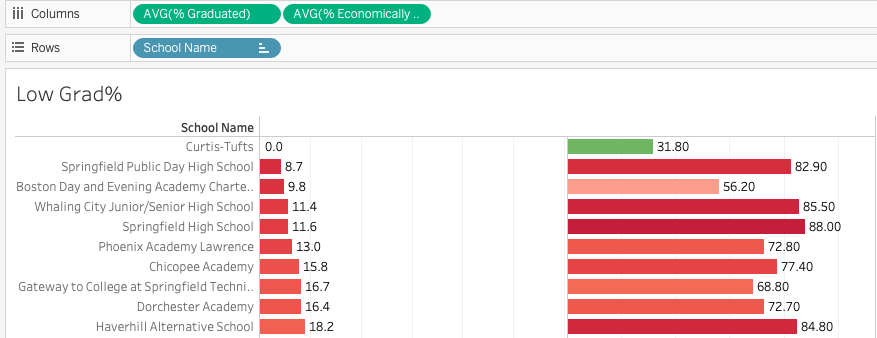
In both graphs red is to indicate either below 50% graduation percentage (column on the left) or greater than 50% economic disadvantage (right column). We can therefore see a correlation between economic status and graduation %. There is one outlier school that is worth mentioning. Curtis-Tufts High School had 0% graduation rate but was below the economic disadvantage threshold. One idea is that the school is a smaller private charter, and there happened to be no students graduating in that particular year.
The Role of Class Size
The superintendent was then wondering how college attendance could be increased. They’ve considered investing in building more schools with the aim of lowering the average class size to hopefully increase the percentage attending college.
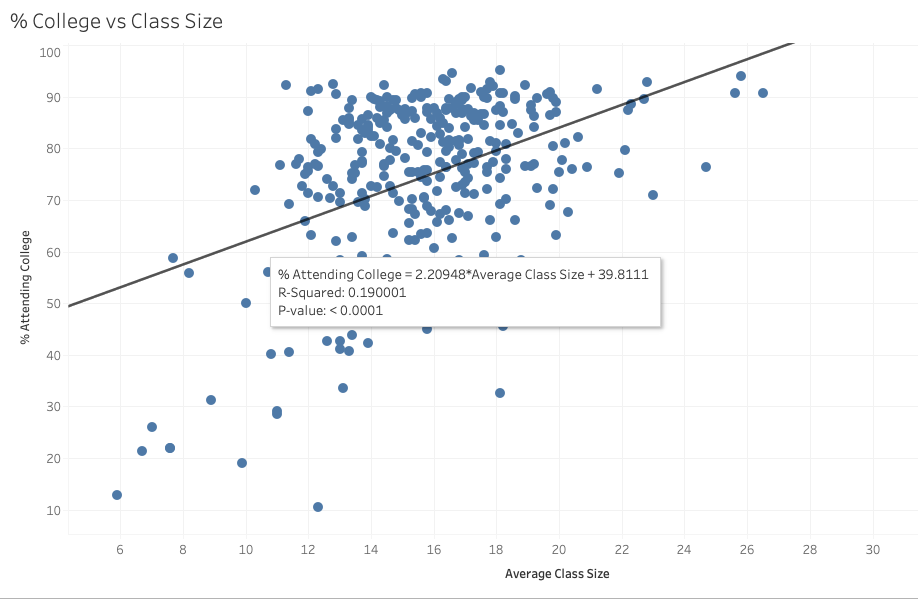
At this point, I decided to compare the average class size to the college attendance %. The results here were a little interesting. There was a general spread of variance, but the bulk was highly concentrated between 12-20 students per class and 60-90% college attendance. To fully understand the relationship between these 2 variables, I plotted a linear regression and found that the R-squared value was only 19%. This means that only 19% of the variance can be explained by the class size. So not great.
Through additional consideration, I then compared the college attendance % against economic status. The following regression shows us a R-squared value of 40%. Meaning that there is a greater correlation here. It doesn’t account for the entirety of the variance, but it is noteworthy to ponder. So, the greater % of economic disability the lower college attendance %.
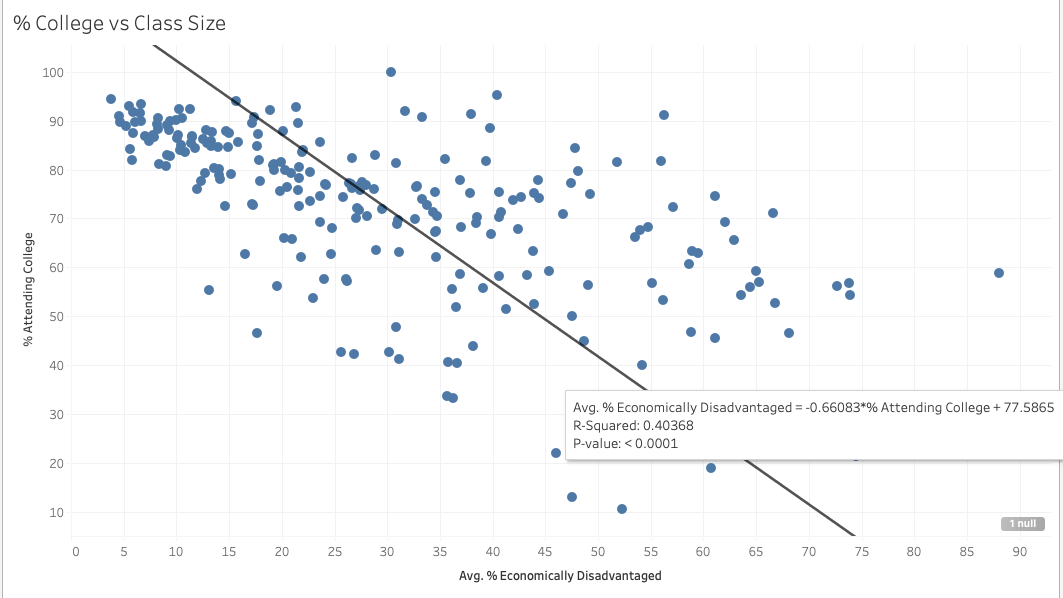
And finally, I decided to weigh the economic status to the original plots to see if this would show us any more insights. The following scatter plot is arranged in color density based on economic status. If the data was below 50% economically disadvantaged, the color would be red. If it was greater, the color would be blue.
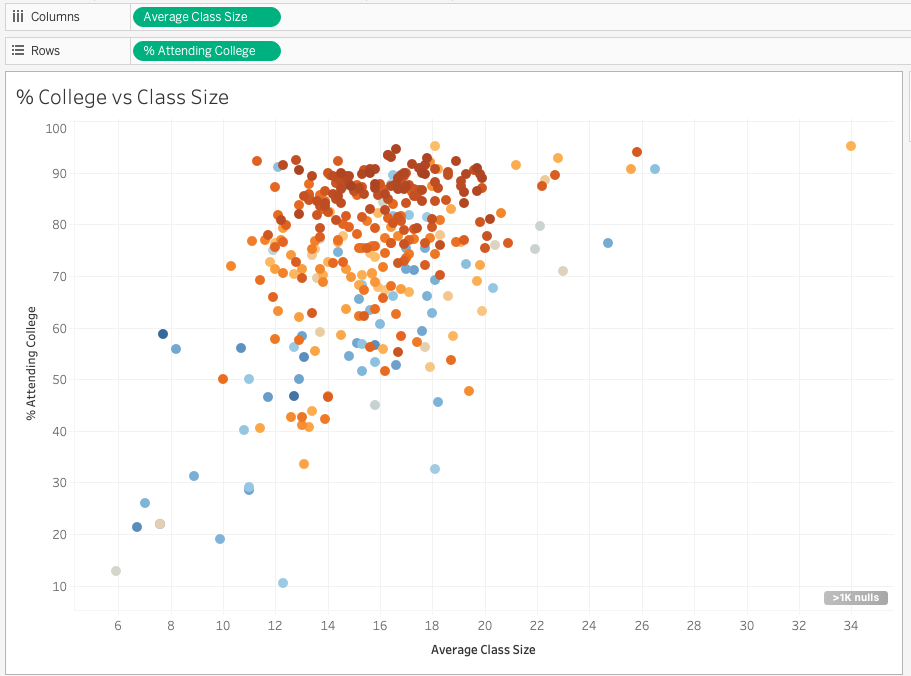
Thus we can see generally speaking, those who come from greater economic disadvantage had a lower college attendance %. Again, the regression model earlier showed us that 40% of that variance is explained by economic status. Looking at class size vs college attendance really doesn’t help the case of investing and building more schools. It just doesn’t make sense. On the other hand, it is worth considering how economic status may affect college attendance.
Top 4th Grade Math Districts
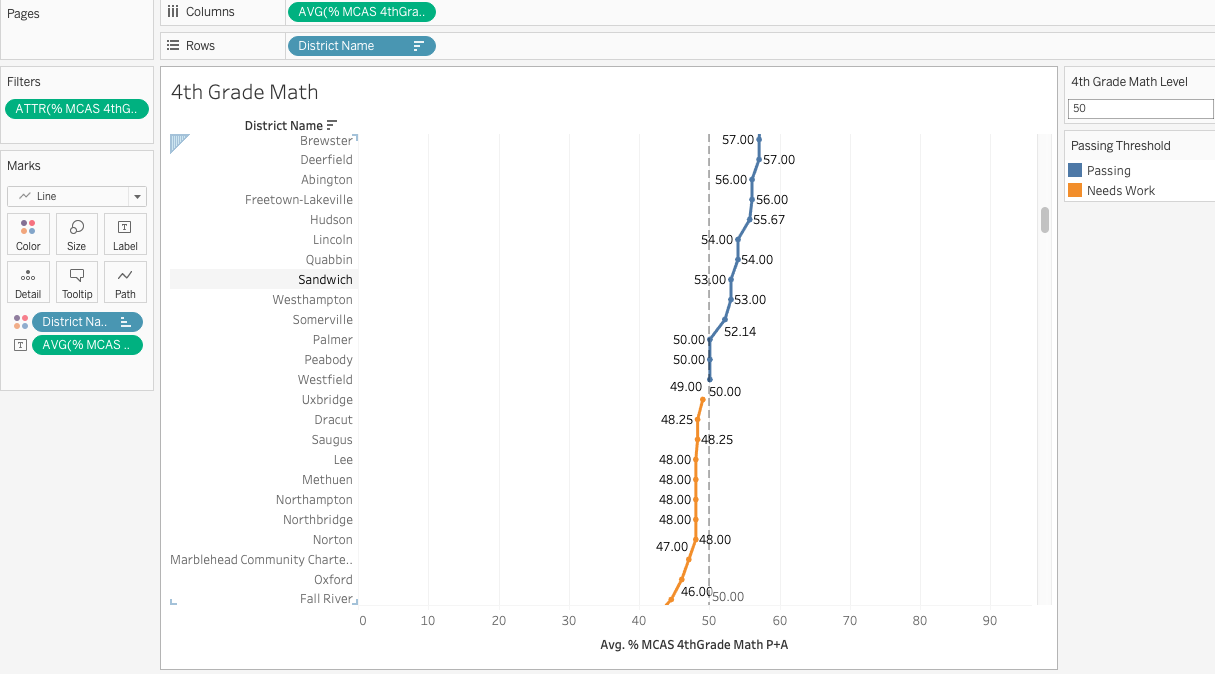
The superintendent finally wanted to know which districts were above the desired threshold of 50% proficiency & would like to collect the names of these districts to invite some of these teachers to train the rest of the state on how they improve math scores.
So, looking at the data, I selected one specific grade to focus on (4th grade), and look at the proficiency in one subject (Math). I made sure to look at the scores above 50% (meaning proficient and advanced according to the data set). And then I compared those data with the different districts in the state of Massachusetts. Upon further work on Tableau I was set a reference line for all of the districts above and below the 50% threshold. The Line Chart shown below indicates that separation. Out of the 100 Districts, 25 of them fell below the 50% threshold.
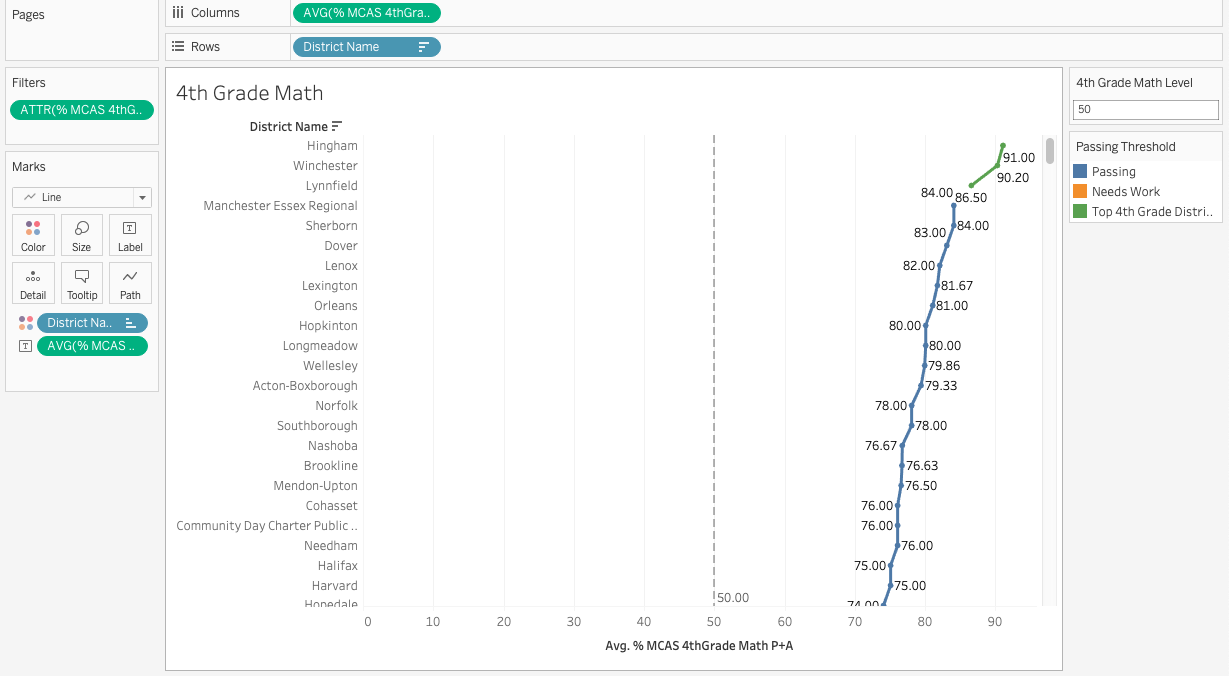
Then I made sure to look at the top 3 Districts, as they would have the best scores and potentially best insights on how the lower districts could improve their math scores. The top 3 districts were: Hingham, Winchester and Lynnfield. The bottom 25% of districts could benefit from these 3.
School Board Report & Dashboard
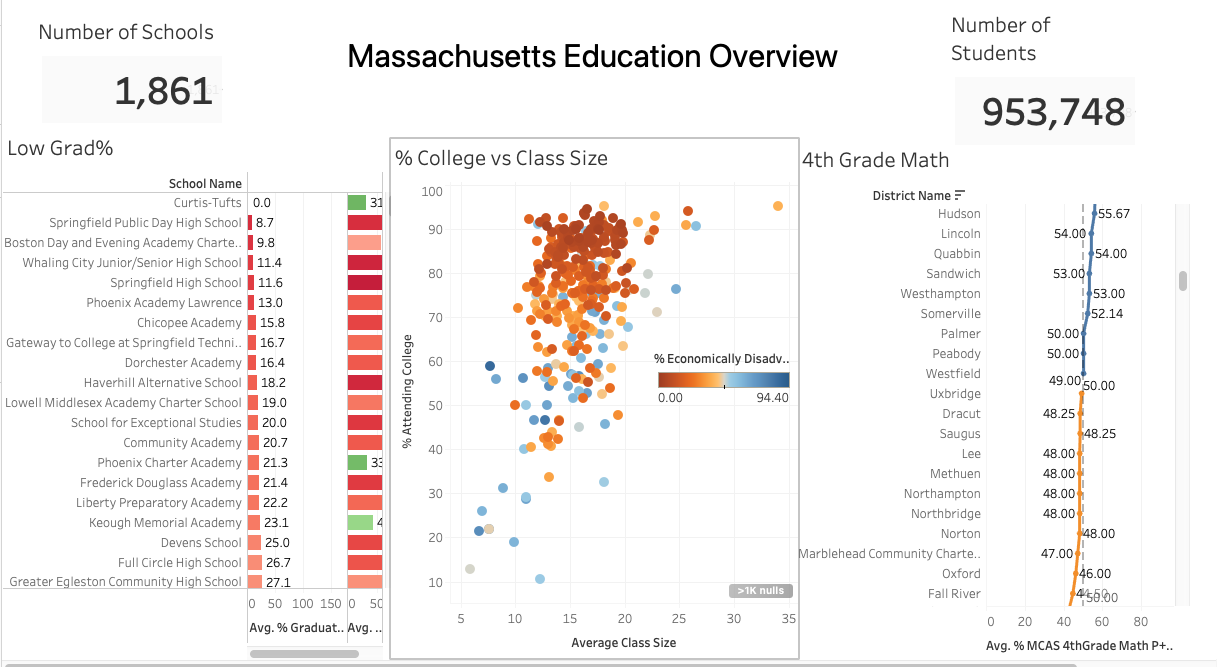
This Dashboard completes the report of all analyses and insights we found from the Massachusetts Education Overview data. In this dashboard the KPIs (Key Performance Indicators) show the total number of schools in Massachusetts and the total numbers of enrolled students.
Conclusion
To recap our analyses from this data set, economic status does have some influence on both high school graduating % and college attendance. Perhaps the governing bodies should look into providing more funding and more help to improve these numbers. Class size does not play any role in college attendance %. I recommend not investing more money in more schools for that reason. And finally, the top 3 districts in 4th grade math ought to help the bottom 25% districts who fall below the 50% proficiency threshold.
Thank you for reading all of this. If you have any questions feel free to comment below or connect with me Brock Johnson on LinkedIn.
I am looking for new opportunities in the data world, so if you hear of any or are in the market please reach out, thanks!